CUPTI Counter Analysis
Note
This is an experimental feature in PyTorch and Holistic Trace Analysis.
Motivation and context
Performance counter measurements can provide insights on how to speed up GPU kernels, conduct roofline analysis and other low level optimizations. The PyTorch Profiler includes a lightweight API to program and measure detailed performance counters from the GPU. This mode leverages CUPTI Range Profiler API and supports an extensive list of performance metrics.
Collecting CUPTI Counter traces
Users can collect performance counters by adding the list of metrics using the experimental config option in PyTorch Profiler. See the code snippet below for an example.
with torch.profiler.profile(
    activities=[torch.profiler.ProfilerActivity.CUDA,
                torch.profiler.ProfilerActivity.CPU],
    record_shapes=True,
    on_trace_ready=trace_handler,
    experimental_config=torch.profiler._ExperimentalConfig(
        profiler_metrics=[
            "kineto__tensor_core_insts",
            "dram__bytes_read.sum",
            "dram__bytes_write.sum"],
    profiler_measure_per_kernel=True),
) as prof:
    res = train_batch(modeldef)
    prof.step()
The generated trace contains the following additional information:
Performance measurement events are logged under the cuda_profiler_range category.
The counter values are logged in the args section of the above events.
For a complete example see here.
CUPTI Counter Analyzer
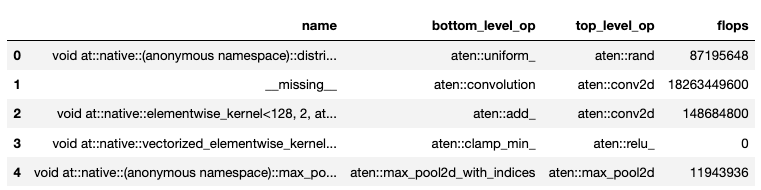
CUPTI Counter trace analyzer can investigate performance measurements per kernel and map kernels to CPU PyTorch operators. A single kernel can map to multiple levels of operators (as operators can be nested). This information is provided in the op_stack column. For further convenience, we add the top and bottom level operator columns as well.
The code below runs CUPTI counter analysis on the collected trace.
analyzer = TraceAnalysis(trace_dir = "/path/to/trace/folder")
gpu_kernels = analyzer.get_cupti_counter_data_with_operators(ranks=[0])[0]
It returns a list of dataframes, one per rank or trace file. Each dataframe contains the kernel name, op_stack (operator stack), top and bottom level op, and columns for individual performance counters as shown below.
Example Notebook
For a detailed walkthrough of this feature see the cupti_flops_analysis notebook in the examples folder of the repo.
To collect the trace used in the example we ran PARAM Benchmarks. PARAM provides a repository of communication and computation micro-benchmarks for AI training and inference. For this example, we ran a simple convolutional neural network model - AlexNet - as a benchmark and collected the trace. Instructions for the same are given below.
# Inside dir "param/train/compute"
$ python -m python.pytorch.run_benchmark -c python/examples/pytorch/configs/alex_net.json -p -i 1 -d cuda --cupti-profiler --cupti-profiler-measure-per-kernel
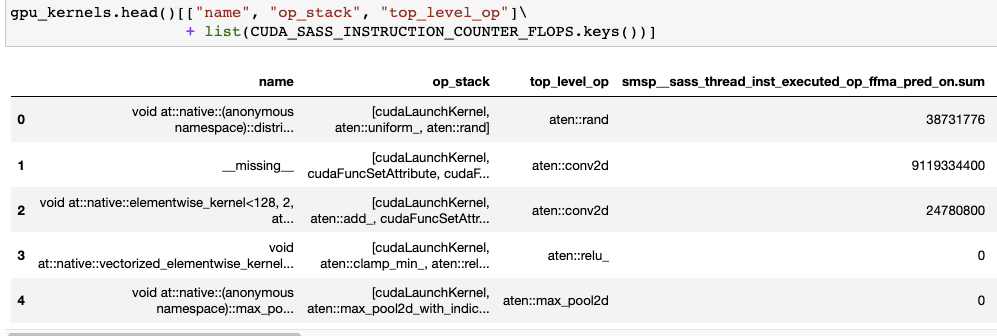
The notebook then uses CUPTI floating point instructions counters to compute FLOPs. FLOPs count can be utilized for roofline analysis and performance optimization.