Trace Diff
Occasionally, users need to identify the changes in PyTorch operators and CUDA
kernels resulting from a code change. To support such a requirement, HTA
provides a trace comparison feature. This feature allows the user to input two
sets of trace files where the first can be thought of as the control group
and the second as the test group as in an A/B test. The Trace Diff class
provides functions to compare the differences between traces and functionality
to visualize these differences. In particular, users can find operators and
kernels which were added and removed from each group along with the frequency
of each operator/kernel and the cumulative time taken by the operator/kernel.
The TraceDiff class has 4 methods:
compare_traces - Compare the frequency and total duration of CPU operators and GPU kernels from two sets of traces.
ops_diff - Get the operators and kernels which have been:
added to the test trace and are absent in the control trace
deleted from the test trace and are present in the control trace
increased in frequency in the test trace and exist in the control trace
decreased in frequency in the test trace and exist in the control trace
unchanged between the two sets of traces
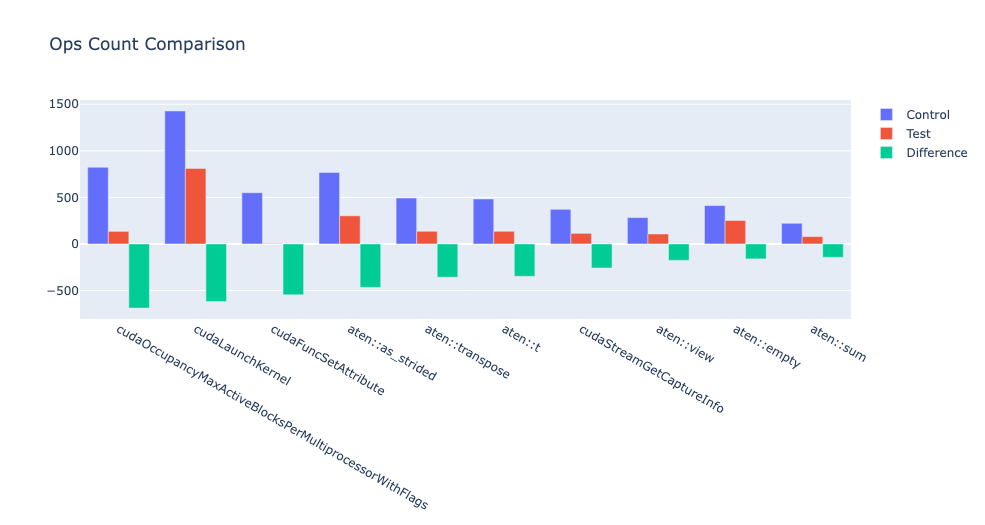
The last two methods can be used to visualize various changes in counts and durations of CPU operators and GPU kernels using the output of the compare_traces method.
E.g. The top 10 operators with increase in frequency can be computed as follows:
df = compare_traces_output.sort_values(by="diff_counts", ascending=False).head(10)
TraceDiff.visualize_counts_diff(df)
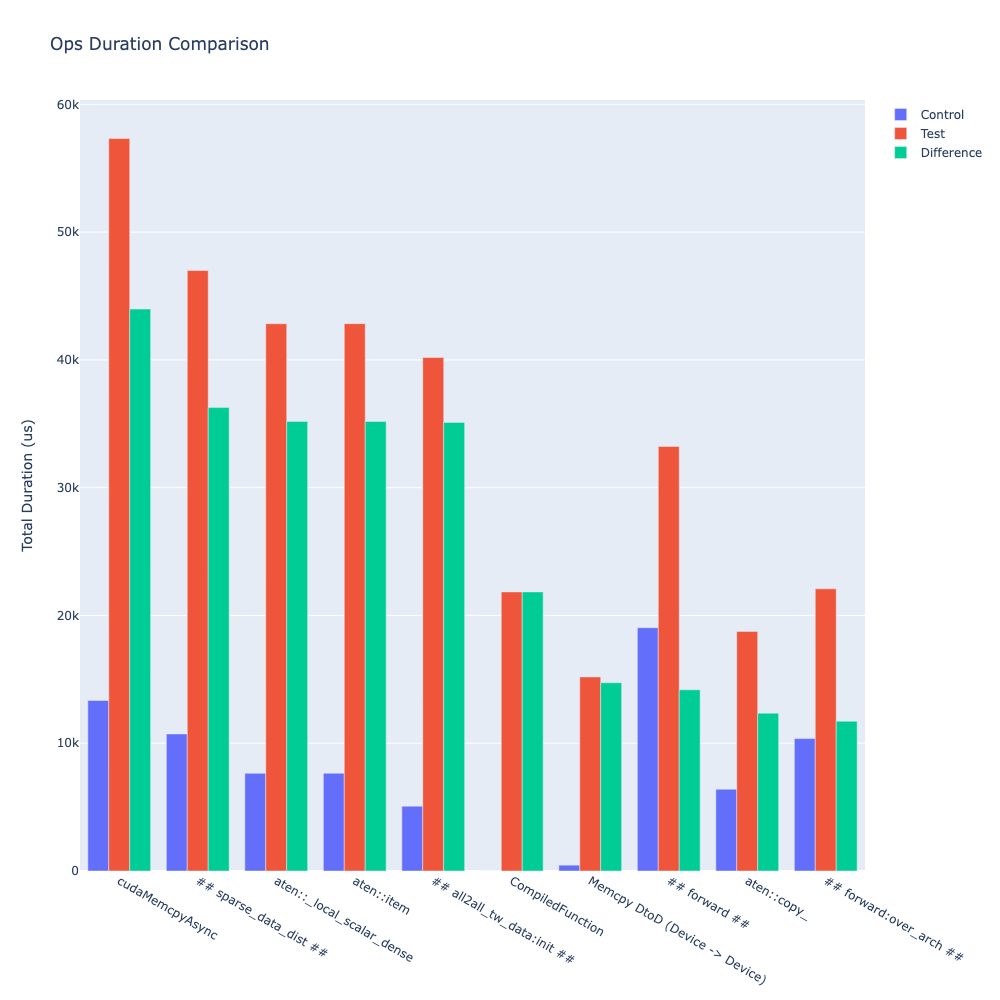
Similarly, the top 10 ops with the largest change in duration can be computed as follows:
df = compare_traces_output.sort_values(by="diff_duration", ascending=False)
# The duration differerence can be overshadowed by the "ProfilerStep",
# so we can filter it out to show the trend of other operators.
df = df.loc[~df.index.str.startswith("ProfilerStep")].head(10)
TraceDiff.visualize_duration_diff(df)
For a detailed example of this feature see the trace_diff_demo notebook in the examples folder of the repo.