Frequent CUDA Kernel Sequences
Consider a scenario where a sequence of CPU ops is called repeatedly in the code. E.g. this behavior is commonly exhibited in a transformer architecture with a large encoder or decoder stack. Suppose the user wants to know the most frequent CUDA kernel sequences originating from an operator. Identifying these frequent CUDA kernel sequences and their corresponding CPU ops provides insights into which kernels would be ideal candidates for fusion.
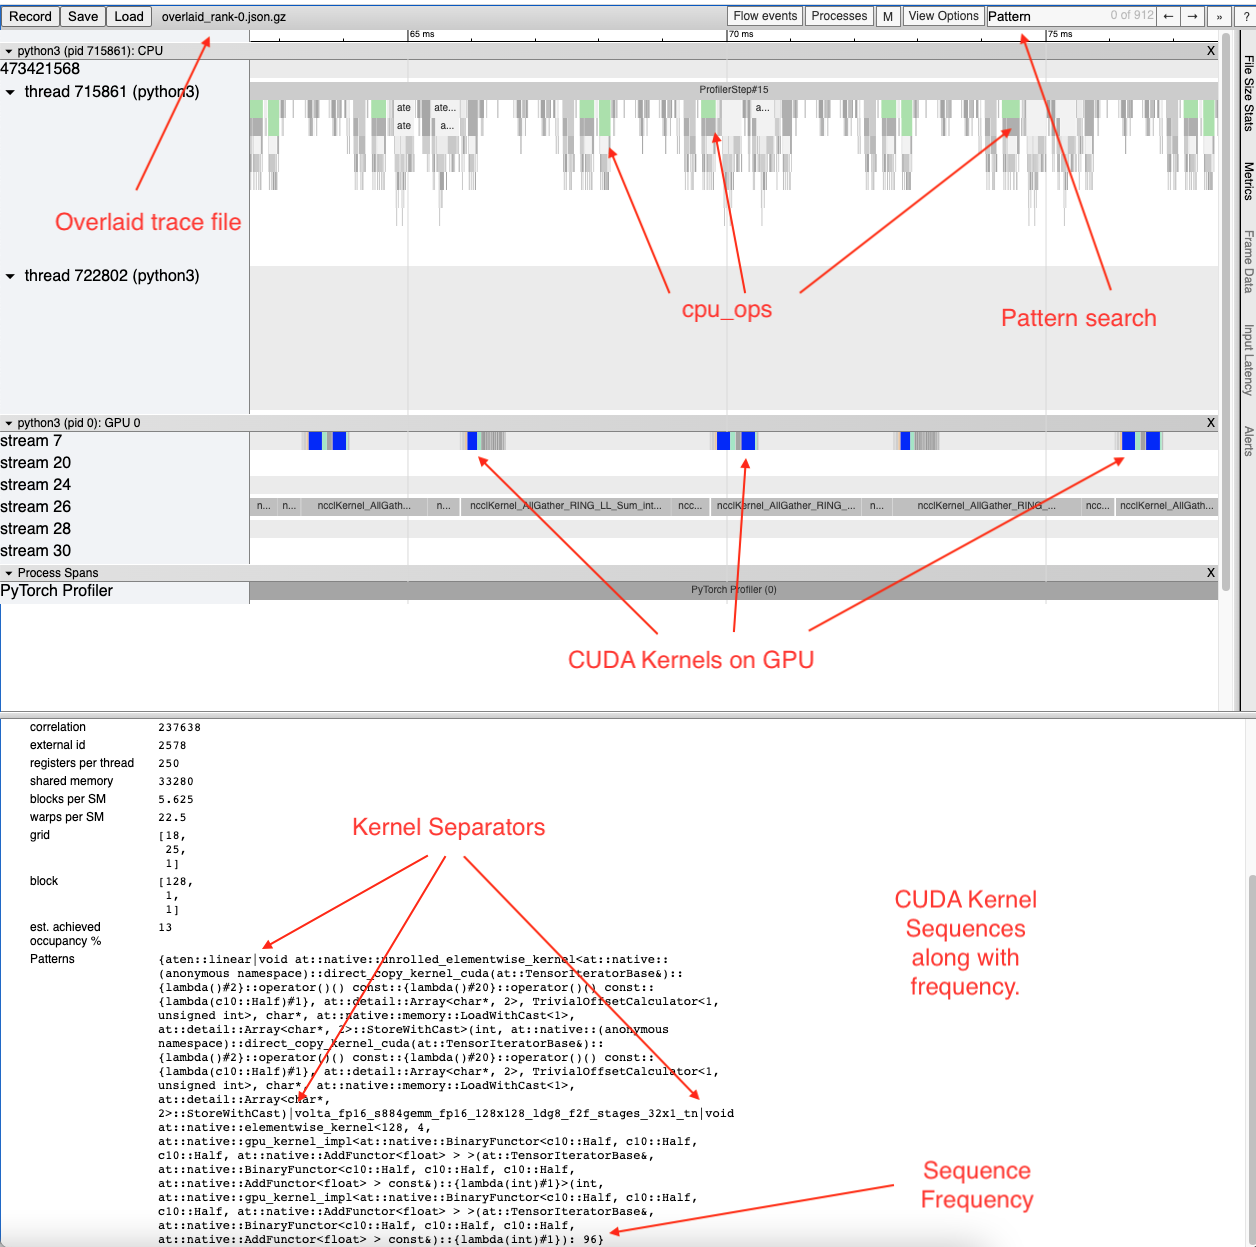
This feature finds the sequences of most frequent CUDA kernels launched for any
specified operator. It generates a new trace file which overlays the top k
identified patterns on the original trace file. Searching for the keyword
Patterns in the new trace file highlights the relevant CPU and GPU ops. The
highlighted events indicate where to look for opportunities to fuse CUDA
kernels or CPU ops.
This analysis is done on a single rank as the CPU and GPU ops are expected to be the same across different ranks.
analyzer = TraceAnalysis(trace_dir = "/path/to/trace_folder")
cuda_sequences_df = analyzer.get_frequent_cuda_kernel_sequences(
    operator_name = "aten::linear",
    output_dir = "/tmp/"
)
The minimum length of the CUDA kernel sequence that should be identified can be
specified using the min_pattern_len argument and the top_k argument
allows the user to specify the top k patterns in terms of frequency to be
overlaid on the new trace file.
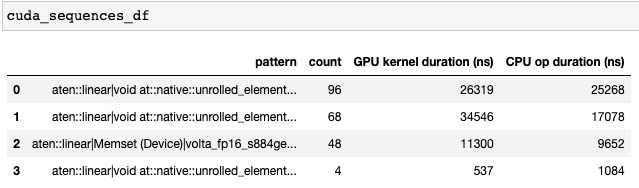
The output of the get_frequent_cuda_kernel_sequences is a dataframe containing a pipe separated string of the CUDA kernels originating from the CPU operator along with their frequency and duration of the CPU ops and GPU kernels.
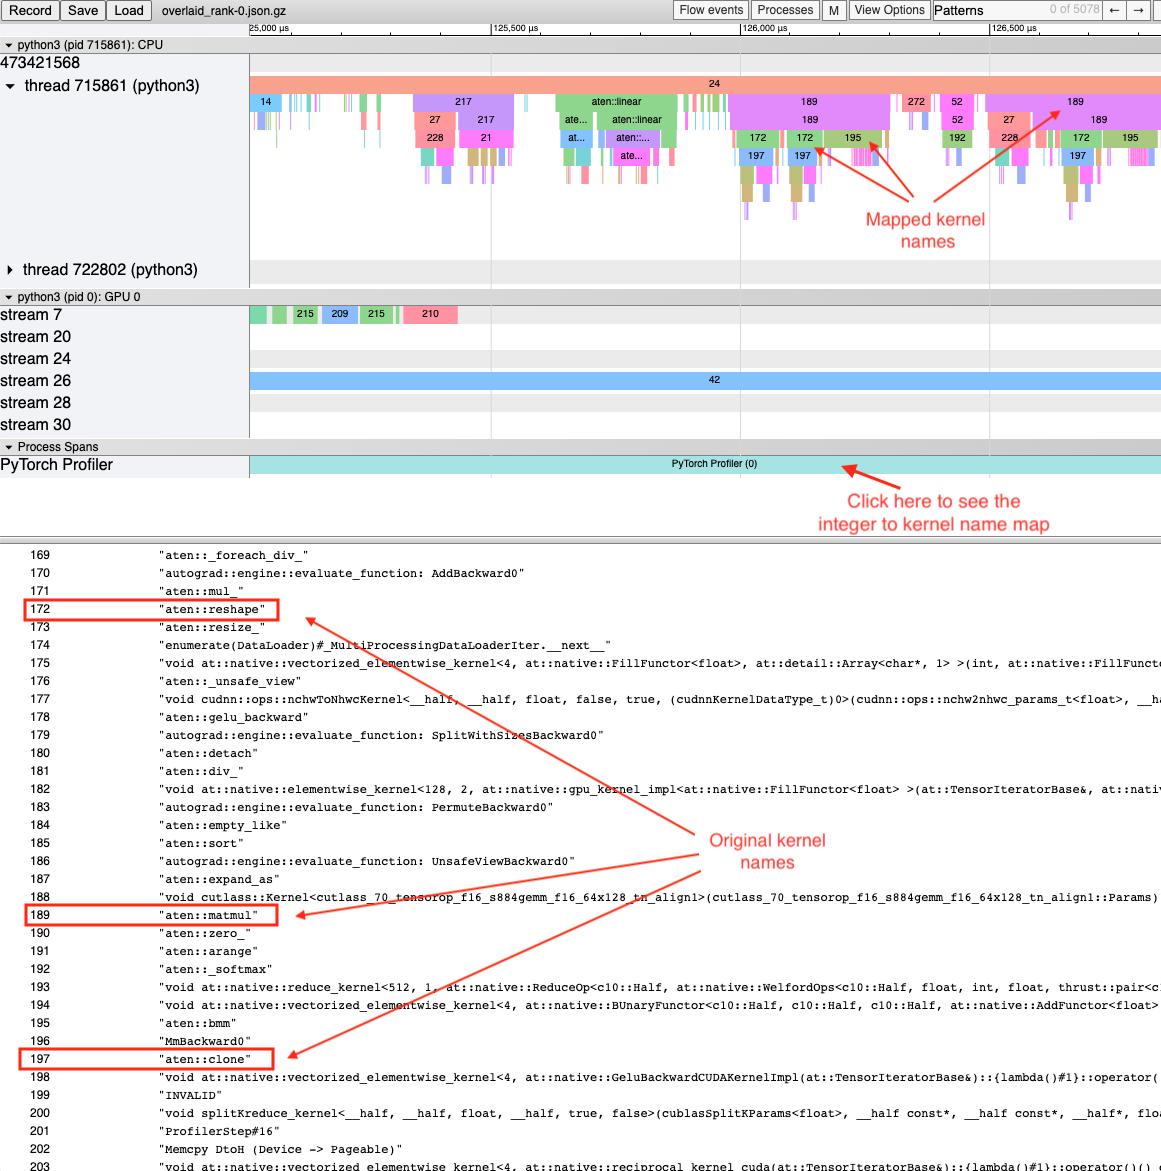
Adding the frequent pattern annotations in the trace file, as seen in the trace screenshot above increases the trace file size considerably. In order to keep the trace file size reasonable HTA creates a dictionary of all kernel names. The keys in the dictionary are integers and the values are kernel names. The overlaid trace file uses these keys to mark CPU ops which are not in the operator search path. To view the dictionary click on the PyTorch Profiler thread with thread id 0.