Idle Time Breakdown
Understanding how much time the GPU is idle and its causes can help direct optimization strategies. A GPU is considered idle when no kernel is running on it. We developed an algorithm to categorize the Idle time into 3 categories:
Host wait: is the idle duration on the GPU due to the CPU not enqueuing kernels fast enough to keep the GPU busy. These kinds of inefficiencies can be resolved by examining the CPU operators that are contributing to the slow down, increasing the batch size and applying operator fusion.
Kernel wait: constitutes the short overhead to launch consecutive kernels on the GPU. The idle time attributed to this category can be minimized by using CUDA Graph optimizations.
Other wait: Lastly, this category includes idle we could not currently attribute due to insufficient information. The likely causes include synchronization among CUDA streams using CUDA events and delays in launching kernels.
The host wait time can be interpreted as the time when the GPU is stalling due to the CPU. To attribute the idle time as kernel wait we use the following heuristic:
gap between consecutive kernels < threshold
The default threshold value is 30 nanoseconds and can be configured using the
consecutive_kernel_delay argument. By default, the idle time breakdown is
computed for rank 0 only. In order to calculate the breakdown for other ranks,
use the ranks argument in the get_idle_time_breakdown
function. The idle time breakdown can be generated as follows:
analyzer = TraceAnalysis(trace_dir = "/path/to/trace/folder")
idle_time_df = analyzer.get_idle_time_breakdown()
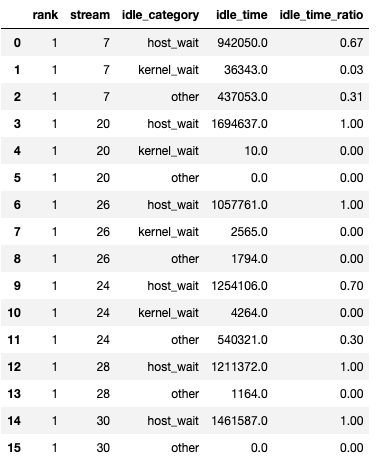
The function returns a tuple of dataframes. The first dataframe contains the idle time by category on each stream for each rank.
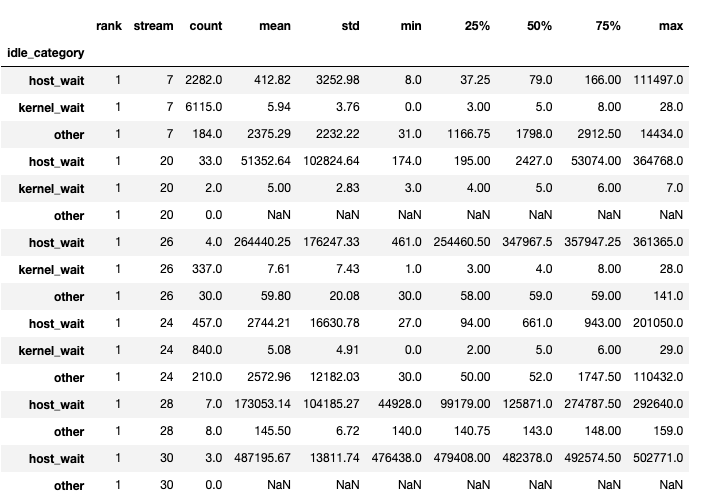
The second dataframe is generated when show_idle_interval_stats is set to
True. It contains the summary statistics of the idle time for each stream
on each rank.
Tip
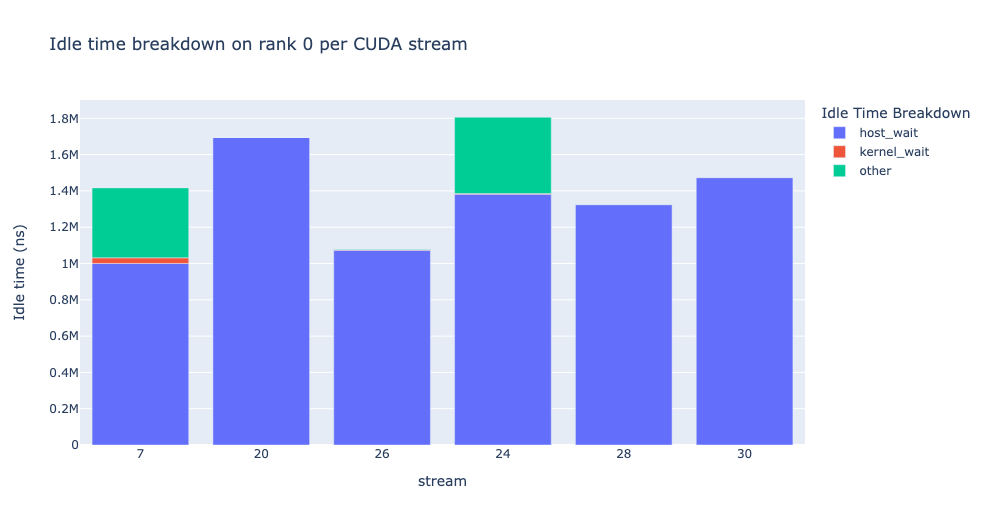
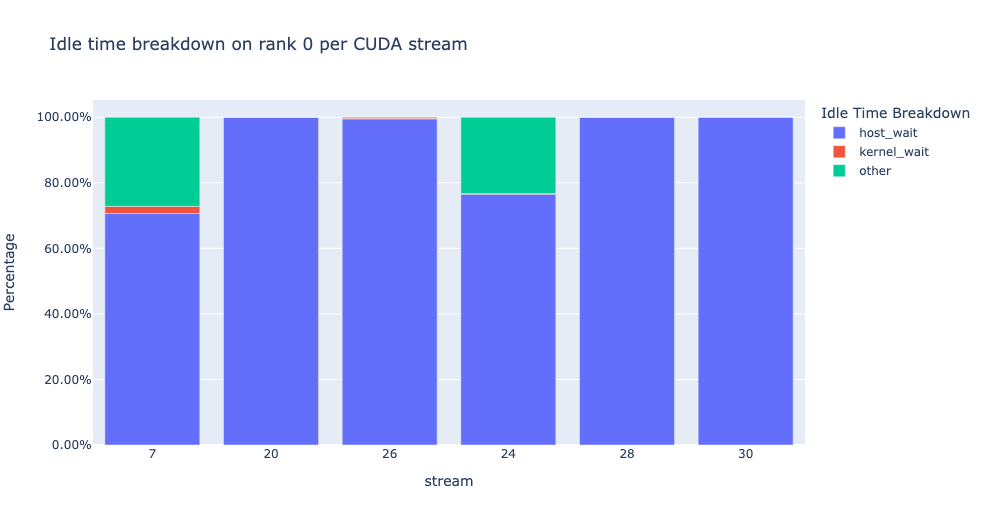
By default, the idle time breakdown presents the percentage of each of the
idle time categories. Setting the visualize_pctg argument to False,
the function renders with absolute time on the y-axis. See image below.