Kernel Breakdown
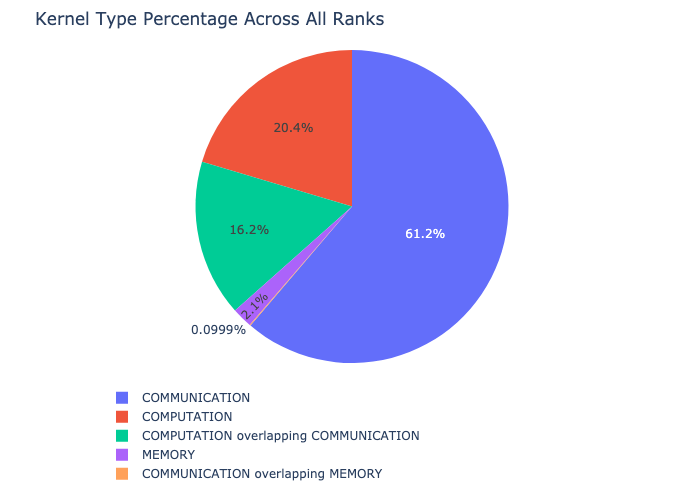
The kernel breakdown feature breaks down the time spent for each kernel type i.e. communication (COMM), computation (COMP), and memory (MEM) across all ranks and presents the proportion of time spent in each category. The percentage of time spent in each category as a pie chart.
The kernel breakdown can be calculated as follows:
analyzer = TraceAnalysis(trace_dir = "/path/to/trace/folder")
kernel_type_metrics_df, kernel_metrics_df = analyzer.get_gpu_kernel_breakdown()
The first dataframe returned by the function contains the raw values used to generate the Pie chart.
Kernel Duration Distribution
The second dataframe returned by get_gpu_kernel_breakdown contains duration summary statistics for each kernel. In particular, this includes the count, min, max, average, standard deviation, sum and kernel type for each kernel on each rank.
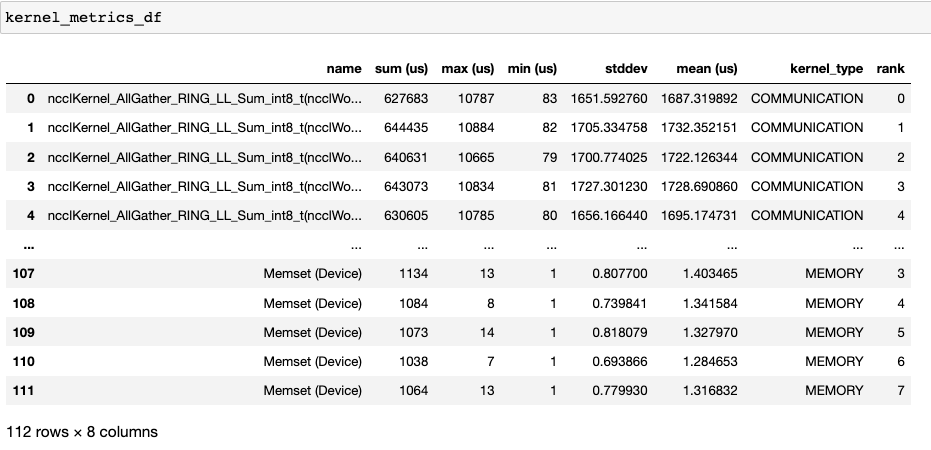
Using this data HTA creates many visualizations to identify performance bottlenecks.
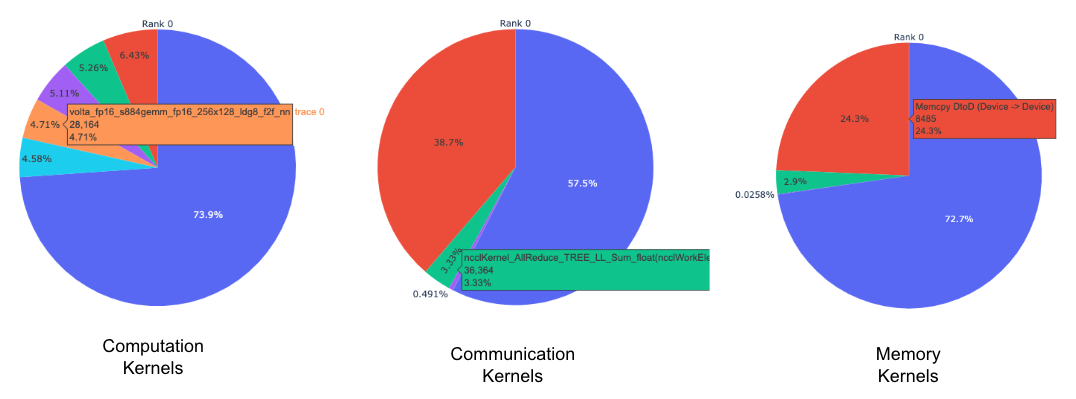
Pie charts of the top kernels for each kernel type for each rank.
Bar graphs of the average duration across all ranks for each of the top kernels and for each kernel type.
Tip
All images are generated using plotly. Hovering on the graph shows the mode bar on the top right which allows the user to zoom, pan, select and download the graph.
The pie charts above shows the top 5 computation, communication and memory
kernels. Similar pie charts are generated for each rank. The pie charts can be
configured to show the top k kernels using the num_kernels argument passed to
the get_gpu_kernel_breakdown
function. Additionally, the duration_ratio argument can be used to tune the
percentage of time that needs to be analyzed. If both num_kernels and
duration_ratio are specified, then num_kernels takes precedence.
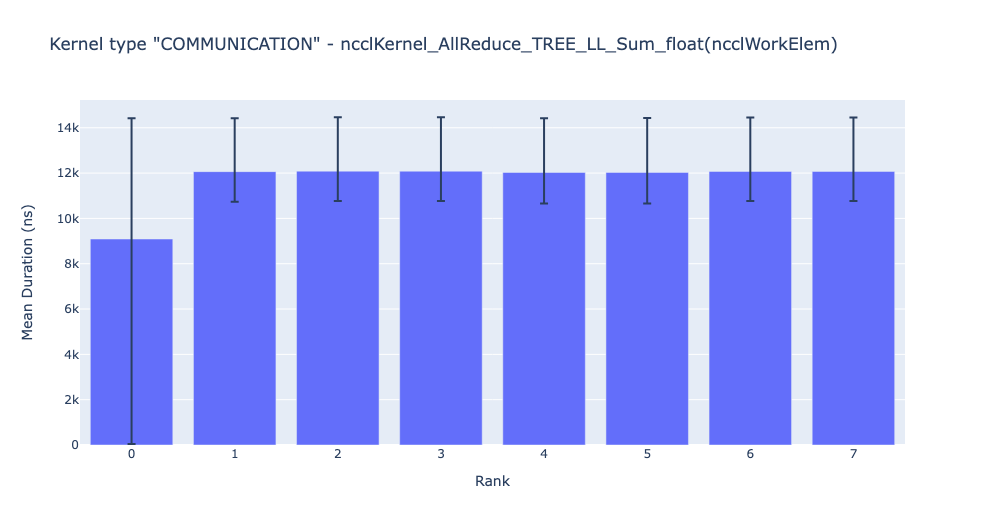
The bar graph above shows the average duration of the NCCL AllReduce kernel across all the ranks. The black lines indicate the minimum and maximum time taken on each rank.
Warning
When using jupyter-lab set the “image_renderer” argument value to “jupyterlab” otherwise the graphs will not render in the notebook.
For a detailed walkthrough of this feature see the gpu_kernel_breakdown notebook in the examples folder of the repo.